Me and viswanathan have developed a excel sheet which compares TWINVEST and SIP. The file can be downloaded at:
twinvest_magnum_index_fund.xls (Screenshot)
Results
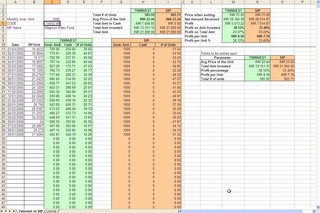
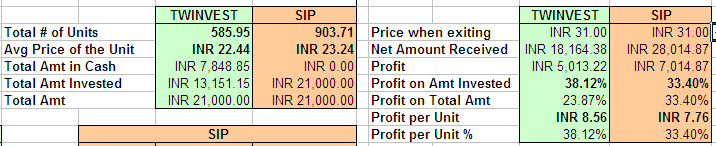 This screenshot shows the differential gains which would have accrued based on Magnum Index Fund using TWINVEST versus SIP.
Parameters
The only parameter is the amount which you can invest monthly. Thats it. Just enter the amount in the designated column. Now when you are going to make your monthly investment, you have to enter two things- Date of your investment
- Price of one unit of the MF
12 x amount you invest monthly, then just start a new twinvest. i.e You can start buying new MF with the monthly contribution which you make. But you have to enter the two things mentioned above and buy the units. The only thing is that your old TWINVEST has became self dependent. It would demand cash when it requires, thats it.
Now the cautions: This method is not for those people who expect to reap huge profits in a small amount of time. TWINVEST would give you better results only with time.
TWINVEST was designed to match the results of SIP with less risk.So TWINVEST would suite people with long term investment horizons.
Second, TWINVEST likes MFs which are agressive and little volatile. So it would perform better if it is used on agressive equity funds. Agressive equity funds are those which invest predominantly in Midcap stocks and in sunrise sectors. To show the performance of TWINVEST I have used an Index fund.
Work is going on modifying the method to perform more better. Comment all your queries/doubts.
12 comments:
In your excel sheet, what matters is the "Profit on total amount". In the SIP case, I make Rs. 7014. In the TWINVEST case I make Rs. 5013. So what is the advantage of TWINVEST in this case? Can you give us a situation where it makes more sense?
(I don't care too much about profit per unit etc. I only care about: I will invest Rs. x per month, and I should get y% annualised. In your example I make more money through SIP)
I would stress to look at the profit % per unit. If you want to look at the total profit amount you get, then also look at the capital employed. Indirectly I would like you to look at the Capital Risk. In the case of TWINVEST your capital risk is less but ROI is maximised. This would mean that at relative lower risk, you are getting higher returns.
Let us assume that BSE/NSE becomes bearish. I am also assuming that you have started investing in the market from 1st Jan, 2005 (as per the excel sheet). And we are selling back the MFs at 19.4 (first buying price as per the excel)p.s Set the column "Price when exiting" to 19.4 for both TWINVEST and SIP. We lose a capital of INR 1783.77 in TWINVEST, whereas in SIP its INR 3468.11.
Looking it from other view, while in TWINVEST, the real loss calculation is.
Net Amount Received: INR 11,367.38
Amt in Cash: INR 7848.85
Total Amt received: INR 19,216.23
Hence real loss is INR 21,000 (Total Amt available for investment) - 19216.23 = INR 1783
whereas in SIP,
Total Amt invested: INR 21,000
Net Amount received: INR 17531.89
Net Loss: INR 3468.11
I think this calculation would have shown how effective TWINVEST is. While investing we shouldn't be biased towards share market.
I also mentioned that TWINVEST is for long term investment method. If we stay in the market for, say for 5 years (generally a bear and bull cycle lasts for 4 years), then TWINVEST would have performed better than SIP. Reason? TWINVEST would have bought more units @ cheap price during the bearish cycle!!.
One user mailed me his comments on TWINVEST. I have posted it here, Demystifying TWINVEST.
Hope I have made my point clear.
Capital risk is lesser in TWINVEST, I agree, because you've put in less capital :) I have Rs. 1,000 to invest each month; what TWINVEST does is makes me invest lesser when the market is going up and more when the market is down - which is fine, since as you have noted, losses are lesser, and as I have noted, gains are lesser too (because some of your employable capital is not used).
Basically it means TWINVEST is a little bit less riskier, therefore gains are lesser and losses are lesser too.
If you believe that in the long term, prices will be higher than today then an SIP always wins in comparison with TWINVEST. In your own example, for an exit NAV of upto Rs. 24.7, TWINVEST is better (return on total amount); above that SIP is better.
SIP is always bad in a bearish market. In fact it's the worst strategy to have; in a bearish market, you should stay completely in cash until you see a real turnaround.
But I think I like the TWINVEST strategy for the lower risk approach; It may make sense to control risk for slightly lower potential returns.
Deepak, I would still stress that you look on the profit percentage. Because the cash which you have with you can also earn some interest if you invest it even in pure debt instruments, you would surely gather an interest rate of atleast 6% on that. This would mean additional income. Or this money can be also invested in equity MF.
Now when TWINVEST demands more money, you would you have to supply it thats all. I am working on a variant of TWINVEST which would be more efficient than this one.
Now as per my assumption that the MF price will be higher and I also assume that in 4 years, there will be a bullish cycle for 1year and then a bearish cycle for 1 year and then a bullish cycle for 2 years. Theoretically speaking, TWINVEST would have acquired double the number of units and half of the price than SIP in the bearish cycle. Assume that in bullish cycle the price returns to the actual buying price. Well, you have made a killing with TWINVEST.
Really we should look at the ROI, which is a percentage value. This way we are looking at the returns unbiased.
TWINVEST lowers the capital risk and actually provides better return. I would love to test this technique on UTI Master Index fund which was started in 1998, but its a very hard job to find the monthly NAV from 1998 till now and would also have to take into effect the dividends distributed.
Anyway, I have added test data, This data is for 6 years. It can be downloaded at TWINVEST Excel. The output is:
Parameter TWINVEST SIP
Avg Price of the Unit INR 7.62 INR 7.81
Total Amt Invested INR 69,160.71 INR 72,000.00
Profit percentage 18.17% 15.27%
Profit per Unit INR 1.38 INR 1.19
Total # of units 9081.14 9221.43
Profit INR 12,569.58 INR 10,992.86
Made two mistakes with the earlier comment.
1. Missed the link for the new excel. its TWINVEST Test Data Excel
2. The output is garbled. Sorry for that (reason, table html tag is not allowed).. Its here.
TWINVEST:
Profit Percentage: 18.17%
Profit Amount: INR 12,569
SIP
Profit percentage: 15.27%
Profit Amount: INR 10,992
I decided to test this theory with HDFC Equity fund, since 1/1/2001. This is a 70 month period with highs and lows. I have entered exact values as per HDFC mutual fund and found an interesting thing. If you invested Rs. 1000 on 1st of every month (or next working day),and exit at today's NAV (30/10/2006), your earnings are as follows:
SIP
Total Amount invested : Rs. 70,000
Net amount received : 300,678
Net Profit: 230,678 (329.54%)
TWINVEST
Total Amount invested : Rs. 70,000
I assume remaining cash is invested at 6% compounded each month.
Net investment value: 178,251
Cash with interest:46,364
Net Profit: 153,615 (219.45%)
Note that I have even included 6% monthly compounded interest on the cash sum.
I find that if I follow TWINVEST, I will stand to lose 77,000 as compared to SIP, after 70 continuous months.
I think SIP is a much better idea here. Remember also that SIP has less hassle as compared to TWINVEST, plus it is giving much much higher returns. Total returns is the only thing that matters, because in the end you don't care whether you are putting something in cash or equity or whatever; your funda is you put in 1000 per month, how much has it become? SIP has made it grow more, in this case.
Download my excel calculation (your sheet with my changes).
This has been surprising to me as well. I didn't know the difference was so much!
I am sorry for the late reply. I was little occupied. Your excel also made me interested. I would like to tell you one thing, "TWINVEST" was designed with the target of matching the returns of SIP with less risk which is usually associated with SIP. So you would understand the standing point. You get higher returns on the amt you invest, which is proved by your sheet. TWINVEST gives you 505.12% whereas SIP gives 329.54%. I would reiterate that please look at the profit percentage on amt invested. I also understand your concern that what we receive at the end of the period is of important concern and is what really matters. ;)
Deepak, in your excel there was a period of 8 months (May 01 - Nov 01) when TWINVEST was buying more and for the remaining time it had steady rise. As I have mentioned, for better performance TWINVEST would require a volatile MF. A MF which is steadily rising is not volatile. Any way for our analysis, we will keep this factor aside. Since many people wont like to be in a volatile MF.
The steady increase in the MF price led TWINVEST to believe that market is getting hot, so it slowly reduced exposure to it. Hence TWINVEST was sitting on a huge cash. The drawback of TWINVEST is that it doesnt know how to use the huge cash available. There is one more technique SYNCHROVEST. One person has clubbed both TWINVEST and SYNCHROVEST and it seems to give good results..
TWINVEST will not tell you when to sell and how to use the cash. SYNCHROVEST solves the above problem. I am creating the excel from some other excel which is located here TWINVEST_SYNCHROVEST.xls.
I am working on to remodel that to suit us and do a testing on it.
Hi Umesh,
What is the logic behind Twinvest allocating funds to buying MF units and cash. Is it purely based on price of MF or is there a specific formula it uses.
Can you please clarify.
Thanks,
Raj Gopal Vuppala
Hi Raj, the formula is like this. (Your monthly investment amount * 0.75) divided by the the MF NAV when first purchased. This gives the CODE.
Now when you are going to buy the next month, divide CODE by the NAV, this would give the amount of money to invest. This is the logic behind TWINVEST.
Hope it clarifies.
If you look at returns on money invested, TWINVEST will probably work even better if you use a smaller ratio = like 0.5 instead of 0.75 :)
I don't particularly like SIPs, simply because they force you to invest a fixed amount each month. I tend to change the amount invested every month depending on a) how much cash I have to spare and b) how well the market is doing.
That's why I was surprised at SIP doing so well. Of course we have been in a bull run, and SIPs always do well in a bull run. As you said, when things get more volatile we'll perhaps have to use different things.
Overall, my return calculation is on the total sum available, not just on the amount invested. This includes amount in cash when I book profits when I see markets going down, and excess cash not deployed. (Sometimes I invest less than I can because I see an opportunity to do so later)
Like Companies have Return on Equity and Return on Capital Employed, I have Return on Surplus, and Return on Capital Deployed. My ROS tends to be lower than my ROCD, but to my personal balance sheet, only the ROS matters (how much am I worth today, as compared to yesterday).
Hello Rupee, I see that you found my spreadsheets at,
http://www.geocities.com/lostcowboy5/Spreadsheets/
I just want to make clear that TWINVEST_SYNCHROVEST.xls does not have any synchrovest code in it. The original name for it was twinvestnew.xls, and yes you can do with it what you will as long as you don't charge people money for it. I was trying to fix some of the problems I saw in the original twinvest. If you go to http://www.investorshub.com and join there. I have a board in the free section, Systematic Investing Group (SIG).
http://www.investorshub.com/boards/board.asp?board_id=966
I would be more than happy to talk about any of the formula plans there.
Take care,
Clifford
Your Blog is very nice. Equity investments provide higher returns best sip investment plans in india over the long term but come with increased risks.
mutual fund company in india
best trading app in india
mutual fund investment plans
Post a Comment